ITL Attestation — UI Walkthrough
Visual walkthrough of the live Flask web dashboard. All screenshots use the Azure Portal dark theme design system with Bootstrap 5 components.
Run the app: cd src/web && flask --app app run --port 7788
1. Dashboard overview
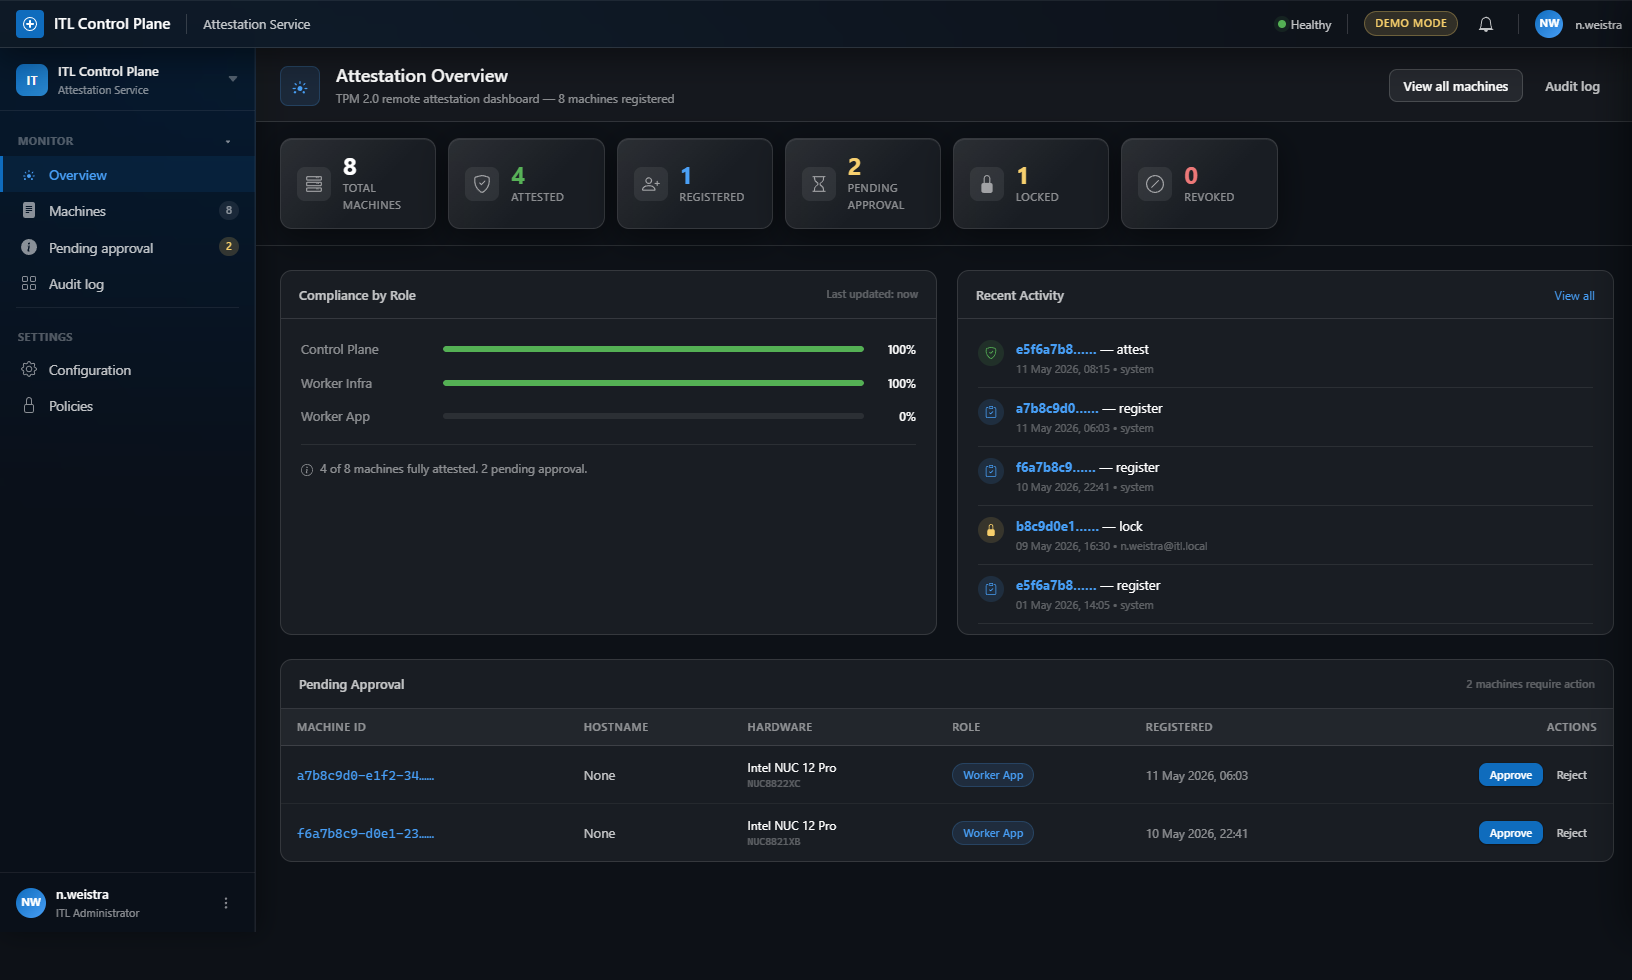
Route: / (dashboard.dashboard)
Six stat tiles showing total machines, attested count, registered count, pending approvals, locked count, and revoked count.
Compliance by Role — Progress bars for each role showing attestation compliance:
- Control Plane (100%)
- Worker Infra (100%)
- Worker App (0%)
Color-coded: green for 100%, yellow for ≥50%, gray otherwise. Info banner showing attested/total/pending counts.
Recent Activity — Timeline feed with colored circular icons per action type:
- Register (blue clipboard icon)
- Attest (green shield icon)
- Lock (yellow lock icon)
- Revoke (red X icon)
Each entry shows truncated machine ID (linked), action label, timestamp, and actor.
Pending Approval — Data table (conditional, only shows if pending machines exist) with columns:
- Machine ID (linked to detail page)
- Hostname
- Hardware (model + serial)
- Role badge
- Registered timestamp
- Actions: inline Approve (blue) and Reject (gray) buttons with confirmation dialogs
2. Machines list
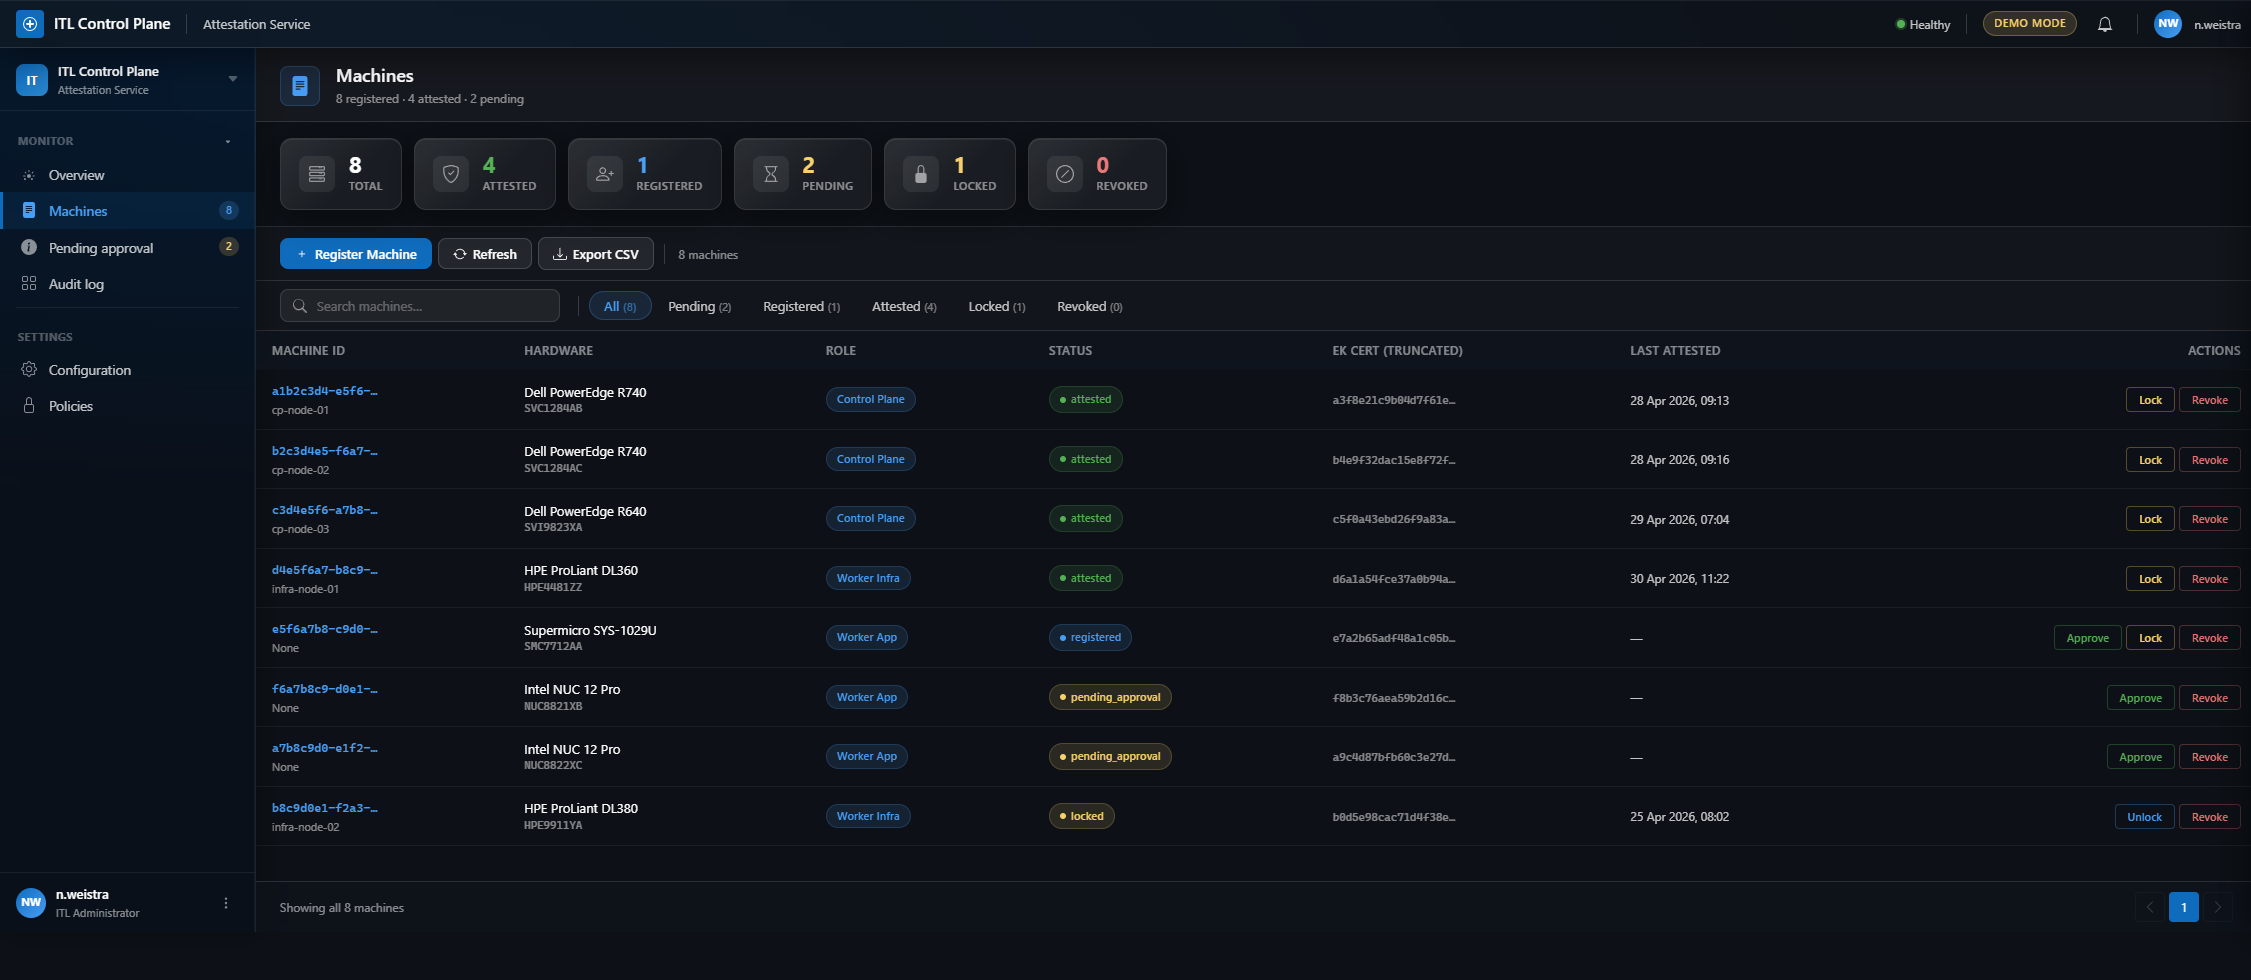
Route: /machines (machines.machines_list)
Full machine inventory with command bar (refresh, export CSV, add machine). Filter chips for status (All / Pending / Attested / Locked / Revoked / Rejected). Data table with machine ID, hostname, role badge, and status badge. Clicking a row navigates to machine detail page.
3. Audit log
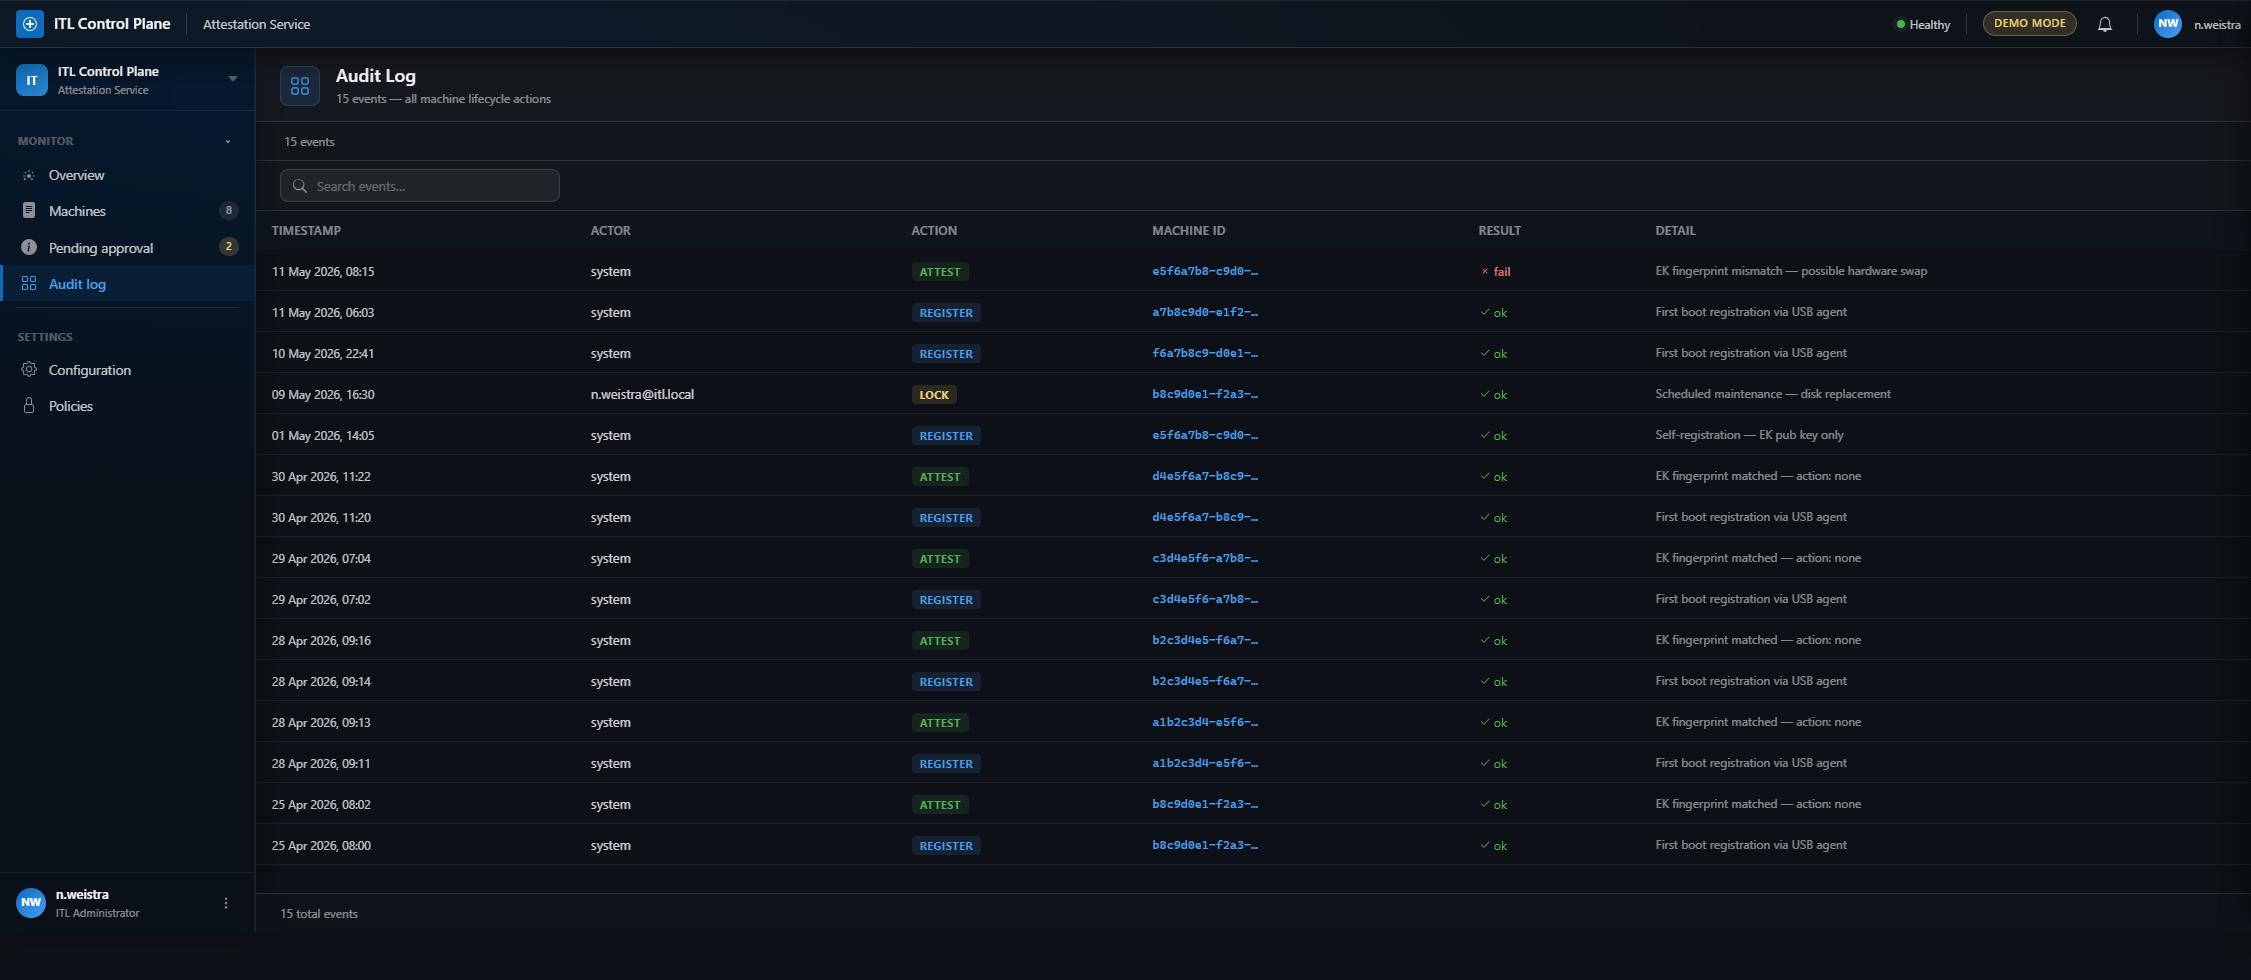
Route: /audit (audit.audit_log)
Comprehensive audit trail showing timestamp, machine ID (linked), action badge (REGISTER / ATTEST / APPROVE / LOCK / REVOKE), and result status. All events are timestamped and linked to their source machine for full traceability.
4. Machine detail
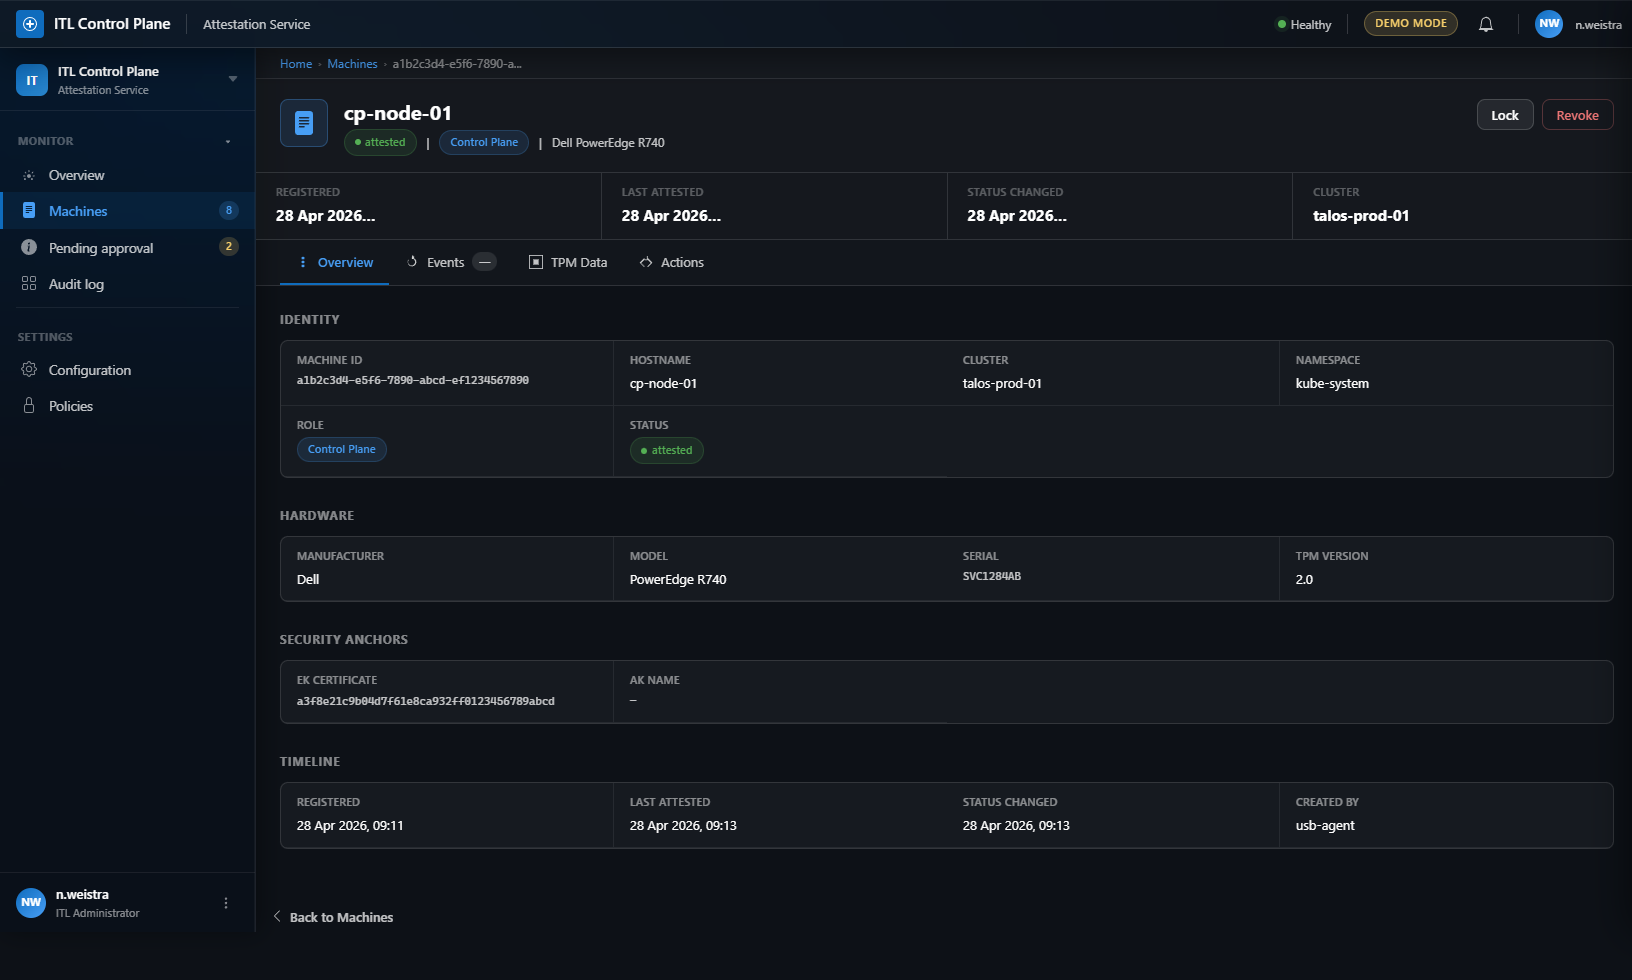
Route: /machines/<machine_id> (machines.machine_detail)
Breadcrumb navigation (Home › Machines › Machine ID). Hero header with machine icon, name (cp-node-01), inline badges (status, role, hardware), and action buttons (Lock, Revoke). Stats row showing Registered, Last Attested, Status Changed, and Cluster.
Tabs
Overview — Four description list sections:
- Identity: Machine ID, hostname, cluster, namespace, role, status
- Hardware: Manufacturer, model, serial, TPM version
- Security Anchors: EK certificate hash, AK name
- Timeline: Registered, last attested, status changed, created by, notes
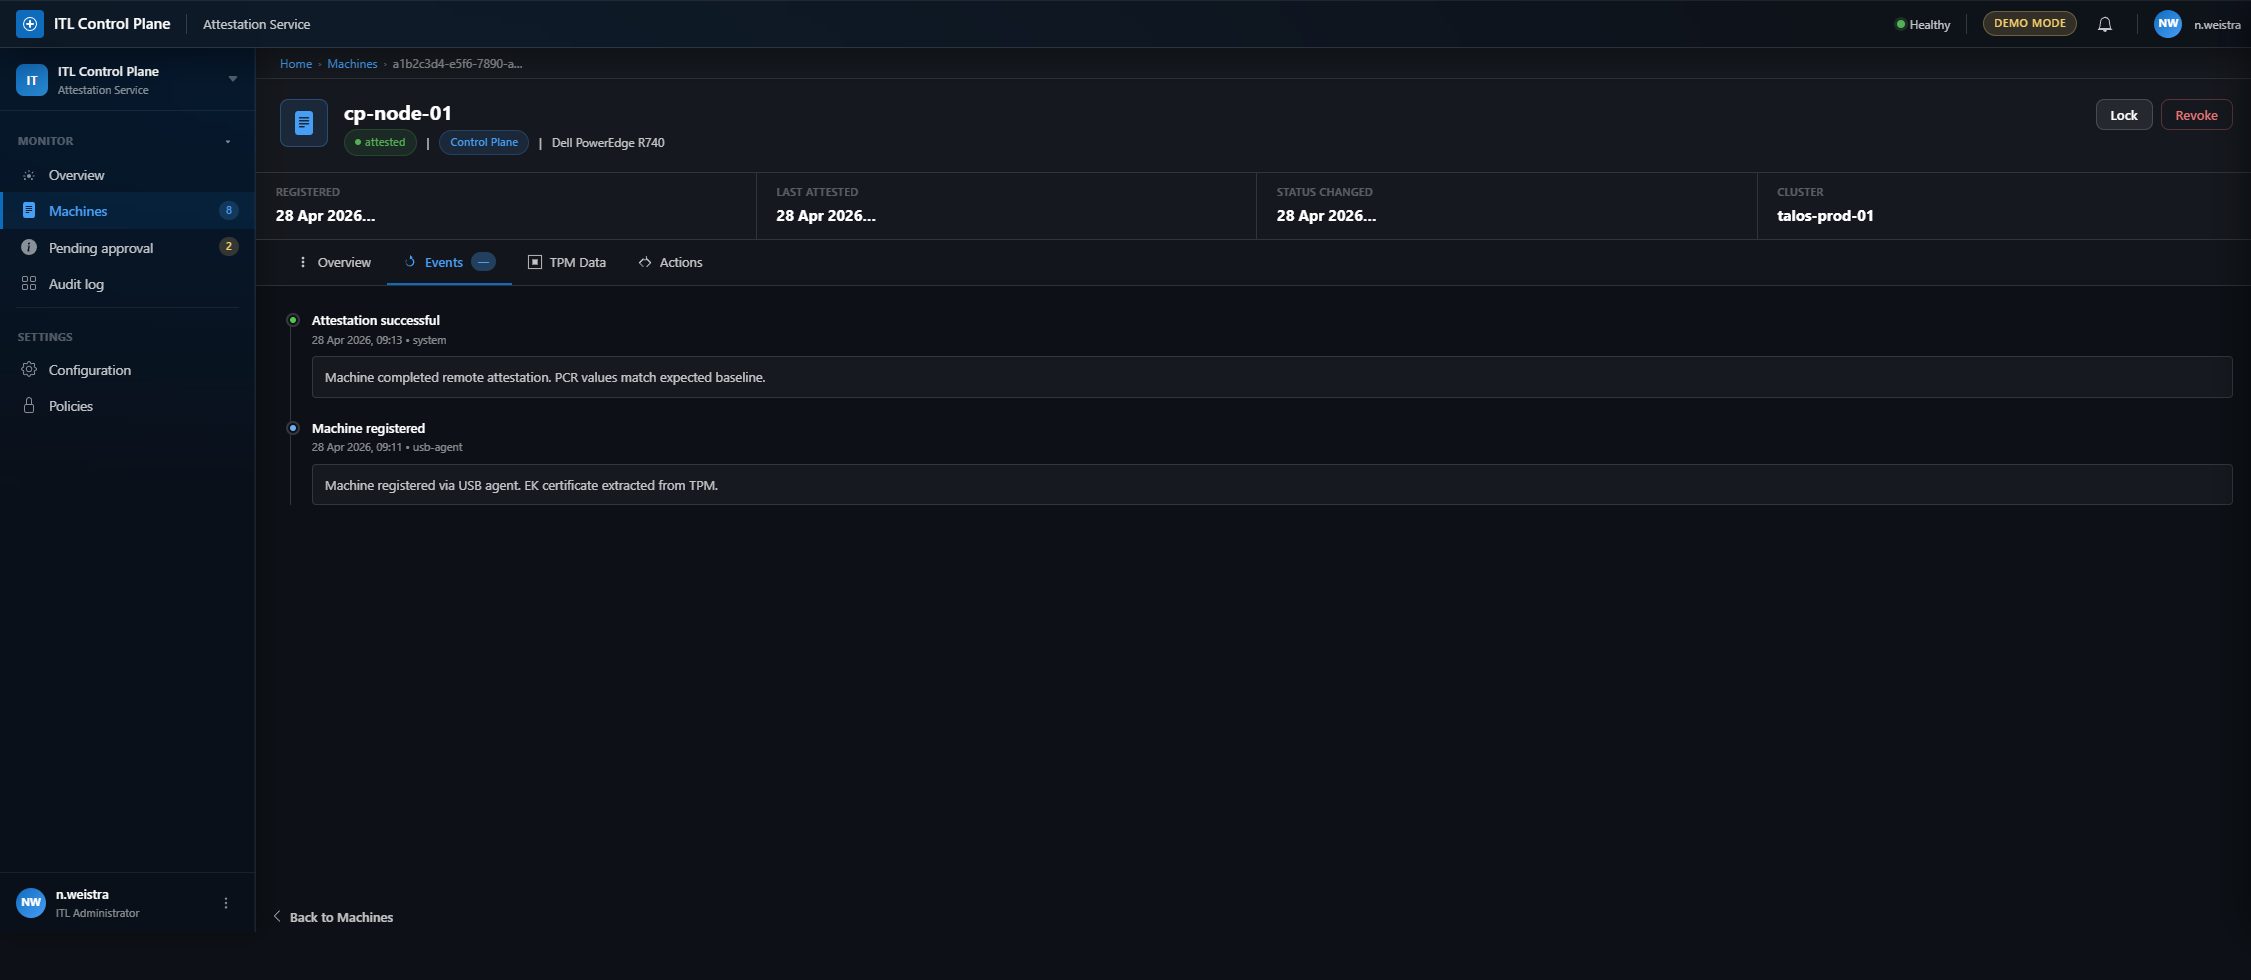
Events — Timeline feed showing machine lifecycle events (registration, attestation, approval, status changes) with timestamps, actors, and detailed event descriptions.
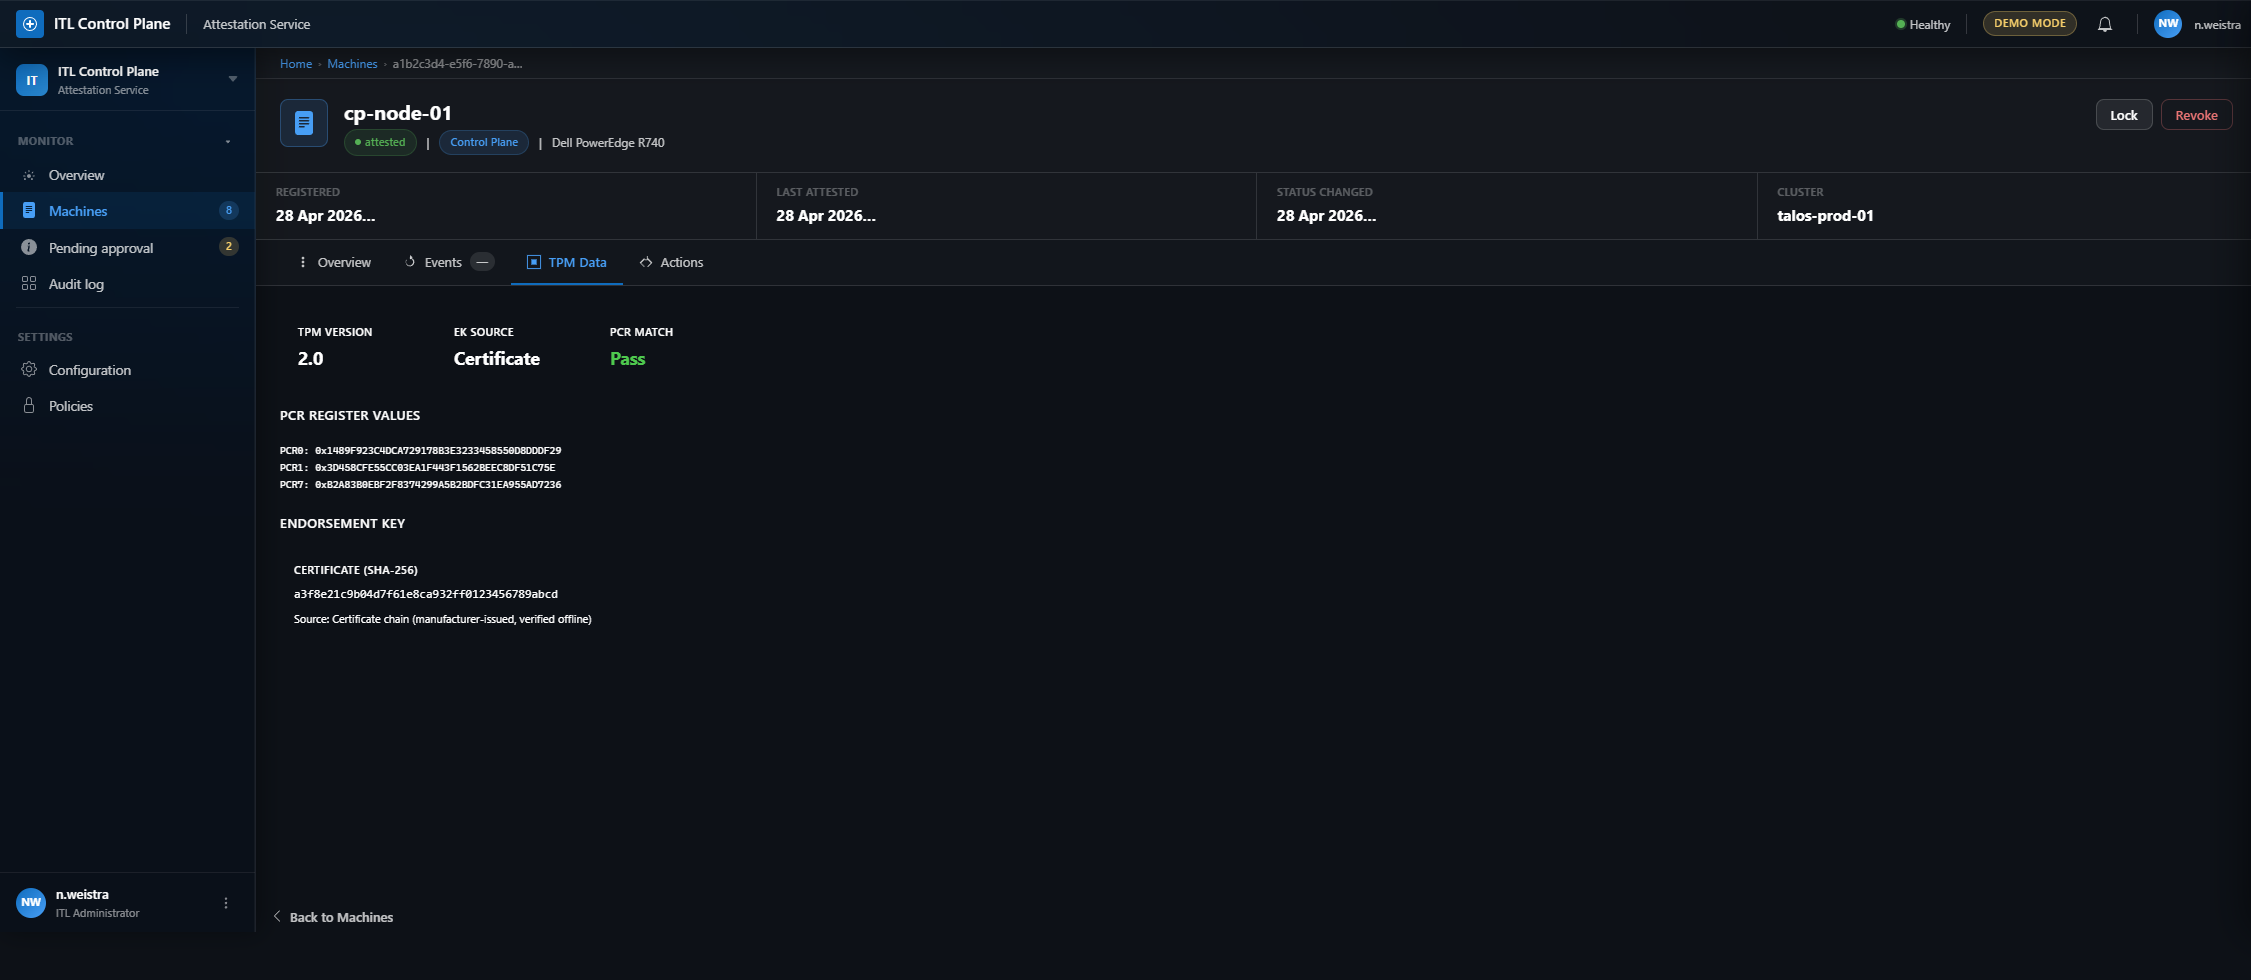
TPM Data — Three stat cards (TPM Version, EK Source, PCR Match status). PCR register values (PCR0, PCR1, PCR7) in monospace font. Endorsement Key certificate hash with source verification note.
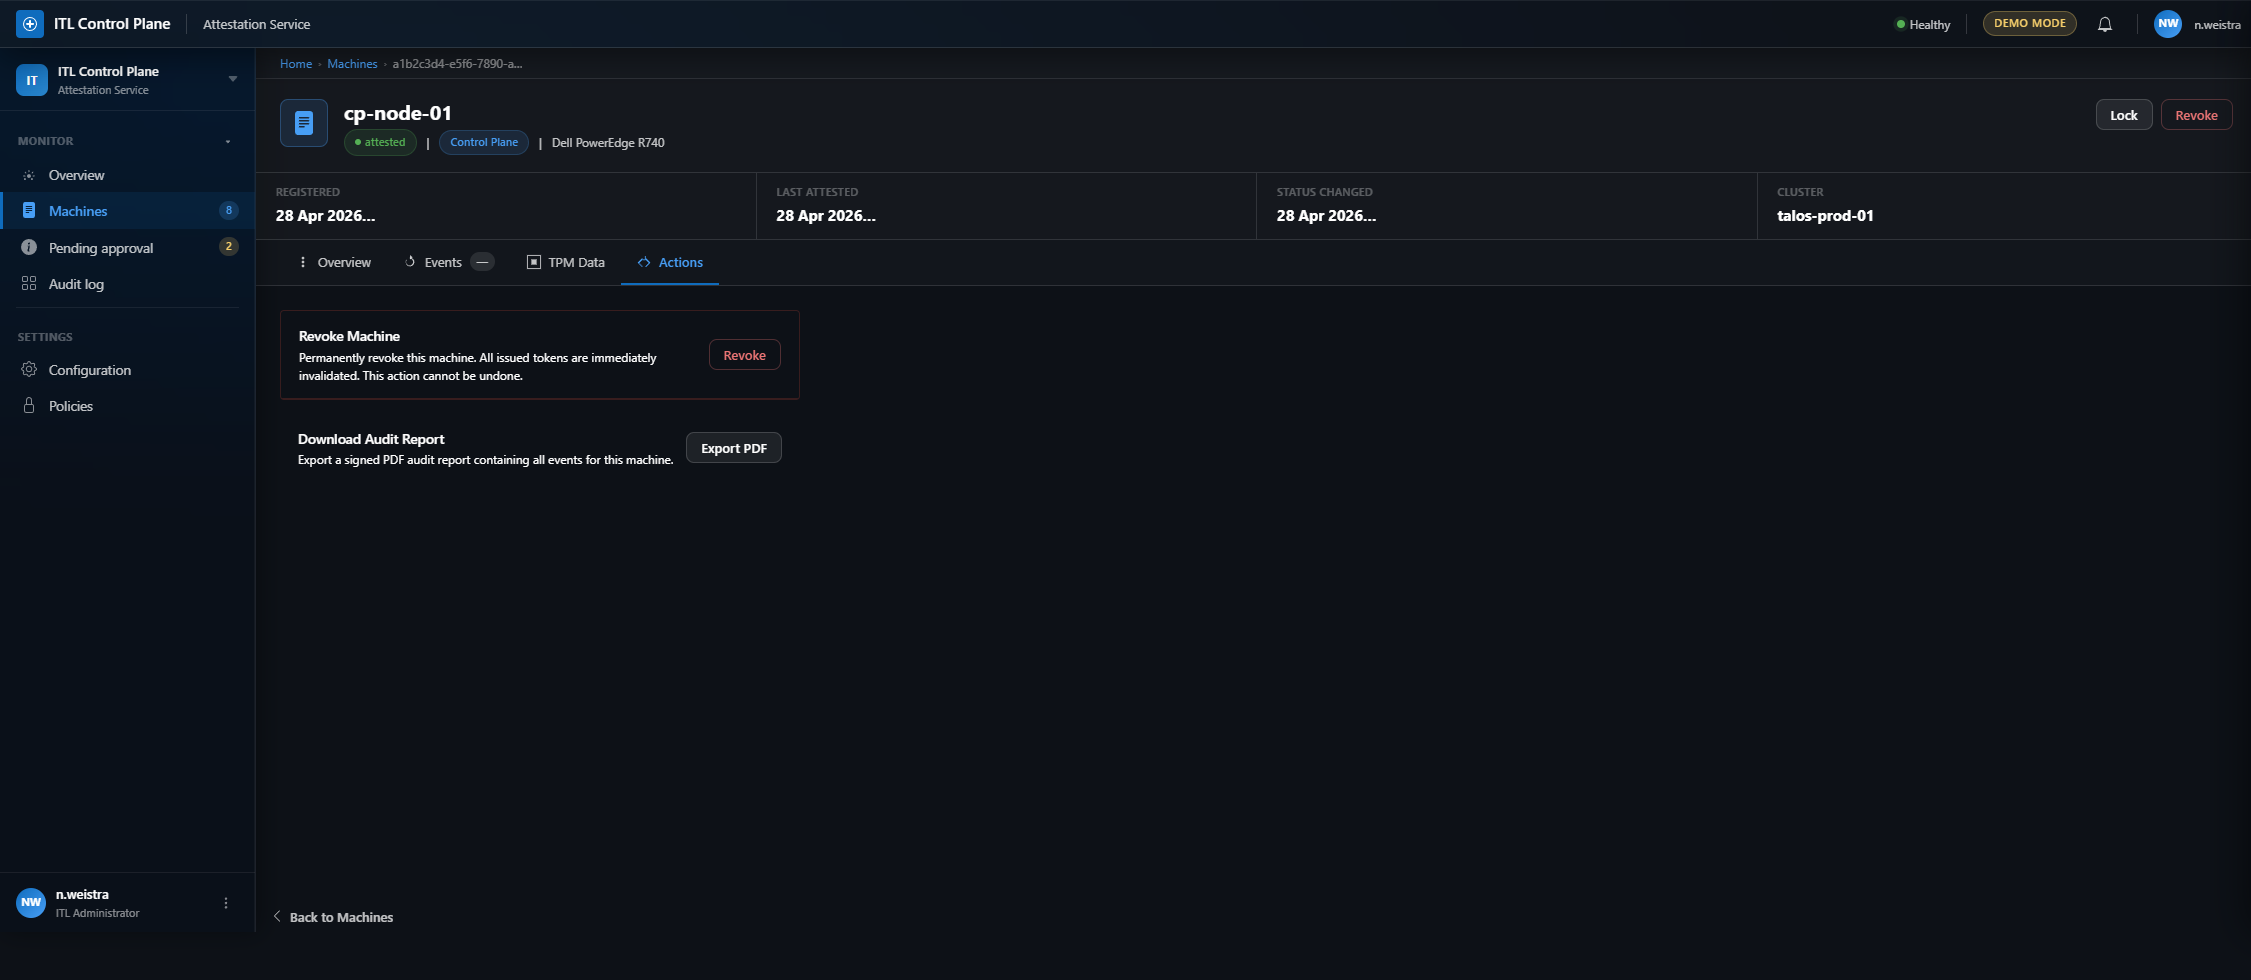
Actions — Contextual action cards based on machine state:
- Unlock Machine (only if locked) — Re-enable attestation
- Revoke Machine — Permanently invalidate machine credentials (destructive action)
- Download Audit Report — Export signed PDF with all events for this machine
5. Configuration
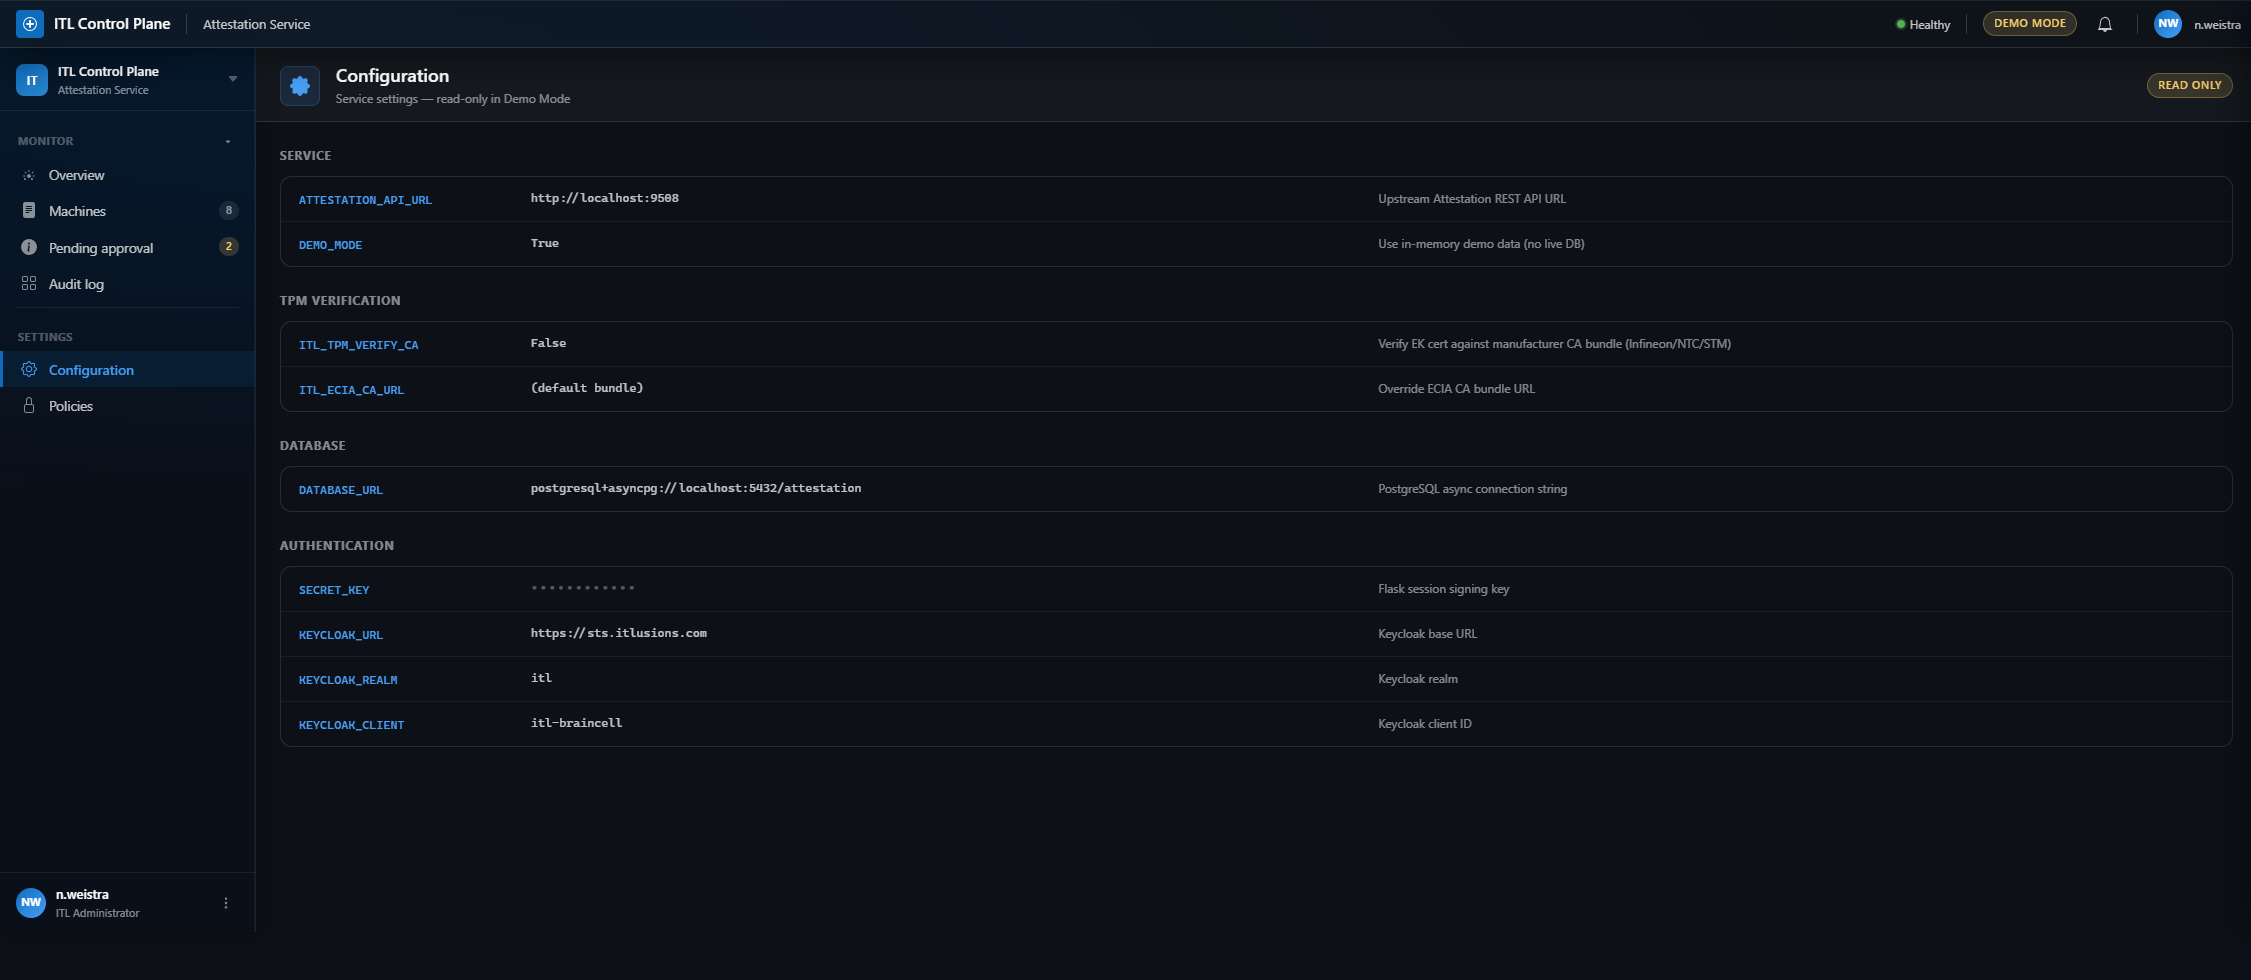
Route: /configuration (configuration.configuration)
Read-only configuration viewer showing all service settings grouped by category:
- Service: Attestation API URL, demo mode flag
- TPM Verification: CA verification toggle, ECIA CA bundle URL
- Database: PostgreSQL async connection string
- Authentication: Secret key (masked), Keycloak URL/realm/client
All settings display key, value (with masking for secrets), and description. Read-only badge indicates demo mode.
6. Policies
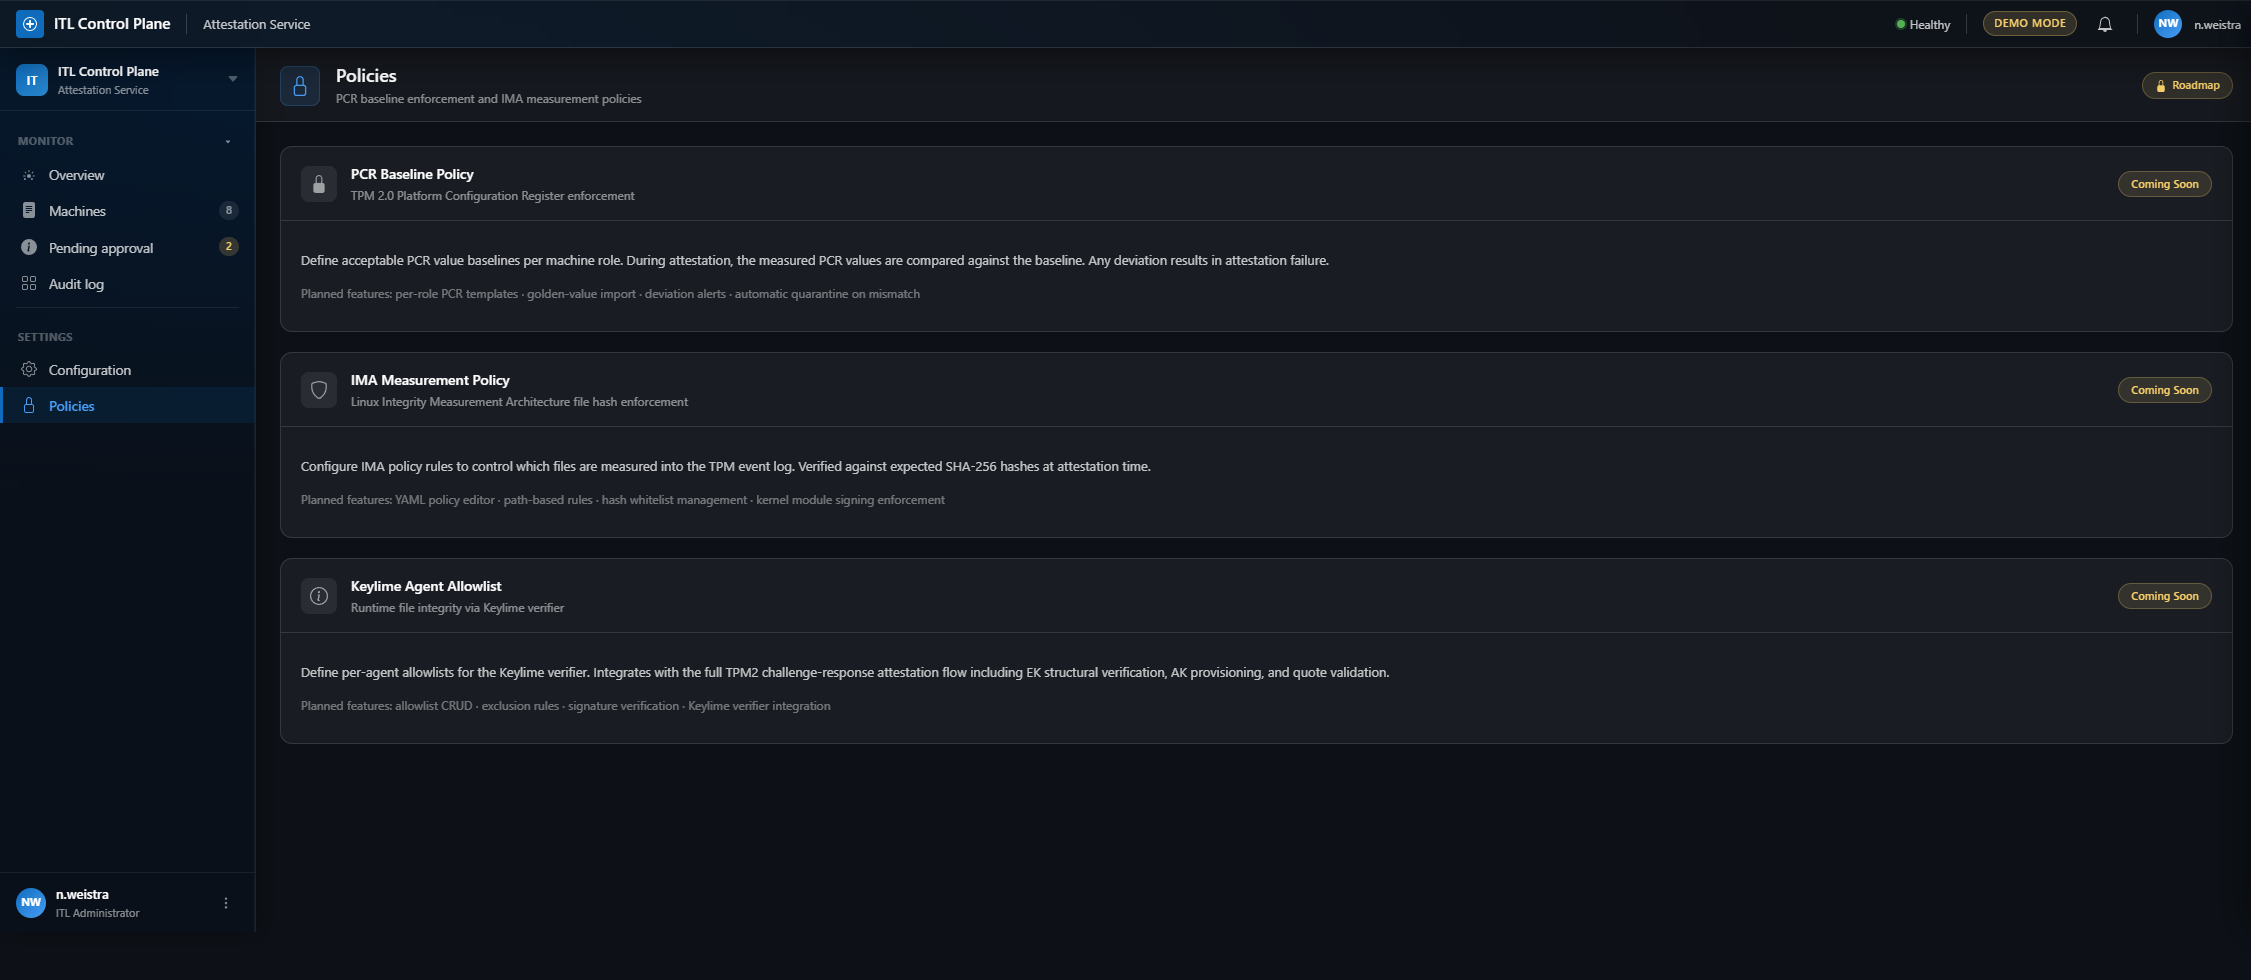
Route: /policies (policies.policies)
Policy roadmap page showing three planned enforcement features:
- PCR Baseline Policy: TPM 2.0 Platform Configuration Register enforcement with per-role templates and deviation alerts
- IMA Measurement Policy: Linux Integrity Measurement Architecture file hash verification with YAML policy editor
- Keylime Agent Allowlist: Runtime integrity via Keylime verifier with TPM2 challenge-response flow
Each card shows “Coming Soon” badge and lists planned features.
Routes
| Page | Route | Blueprint.Function | Purpose |
|---|---|---|---|
| Dashboard | / |
dashboard.dashboard | Stats, compliance, quick actions |
| Machines | /machines |
machines.machines_list | Full inventory with filters |
| Audit log | /audit |
audit.audit_log | Event timeline with traceability |
| Machine detail | /machines/<id> |
machines.machine_detail | Single machine overview |
| Configuration | /configuration |
configuration.configuration | Service settings (read-only) |
| Policies | /policies |
policies.policies | Policy roadmap |